


Visitation at Urayama dam and Takizawa dam
Hello everyone, this is Zhang Zhaoyu a M1 student in the Kawasaki Lab. So glad to introduce you the visitation we had on August 26th, 2022.
This is a visitation organized by the Japan Society of Dam Engineers.
We visited two
dams located in the Arakawa River basin ( Urayama Dam and Takizawa Dam). We
learned basic information about these two dams and also watched how the work are
doing by the staff at the dams.
The dam height of Urayama Dam is 156m and the dam length is 372m. the total water storage capacity is 58 million m³ (of which 2 million m³ is the sediment accumulation capacity), and it is a multi-purpose dam that regulates floods, provides water, controls the river environment and generates electricity.


The Urayama dam
takes the 100-year flood (1000m³/s) as the
design flood and has a flood regulation capacity of 23
million m³ during the flood season. When the design flood comes, the dam
is released at 110m³/s and the remaining water is stored in the reservoir.
In reality, the
largest flood was a record 420m³/s in 2019 when
Typhoon 19 came. Urayama dam has been used safely during floods so far.
The Urayama dam can
provide 4.1m³/s water, of which 65% is provided
to Saitama, 29% to the Tokyo City, and the remaining 6% to the Chichibu area.
It is an important source of water supply for the Arakawa River basin.
The Urayama dam
is often affected by the fact that the water becomes turbid after heavy
rainfall. Many businesses downstream (fisheries, factories, domestic water,
etc.) are affected. The management has taken a series of measures to solve this
problem. Like, the water intake is located about 6km
upstream of the dam and the entire pipeline is made of steel and reinforced plastic
pipes.


To prevent
insufficient oxygenation of the water in the reservoir, six supplemental air
devices have been installed upstream of the dam to ensure water quality.
There are also
devices to prevent driftwood.

The Urayama dam
uses this water to generate electricity while releasing water downstream and
has a capacity of 5,000kw. At the time we
visited it, it’s running in 2.6 m³/s.

We can see that
there are two drainage holes here, one large and one small. The large one has a
drainage capacity of 40m³/s and the small one is
2m³/s. When we need to adjust the water release
in 0.1m³/s, it will be more convenient to use the small hole, and when we need
to release a large amount of water, it will be more convenient to use the large
hole.
Takizawa dam has
a dam height of 132m, a dam length of 424m, and a total water storage capacity
of 63 million m³ (of which 5 million m³ is the sedimentation capacity)
Its function is basically the same as Urayama
dam.


The Takizawa dam
has a 100-year flood level of 1850m³/s, of which
300m³/s will be released and the rest will be stored in the dam, corresponding
to a flood regulation capacity of 33 million m³ during the flood season.
The actual
maximum flood record is still Typhoon 19 in 2019, when the flood flow was 700m³/s. So far the operation of Takizawa dam in the
flood season is still safe.
The water supply
of Takizawa dam is very similar to that of Urayama dam. It provides 4.6m³/s of
water supply, 81% of which is supplied to Saitama and 29% to Tokyo.
The water intake
facility is operated to draw water from a high turbidity layer during discharge,
and to preserve the fresh water layer. When there is no need to discharge, the
goal is to keep the water temperature when we take the water.
Like Urayama
dam, Takizawa dam has a generation capacity of 3400kw.
At the time we
visited it, it’s running in 1.5m³/s.

The Urayama dam
has a common spillway (3m³/s) and two spillways for extraordinary periods
without gates (natural overflow).

The Takizawa dam
has a common water intake as well as three emergency spillways with arc gates,
which are operated by the winches inside the dam on both sides. These machines
are well maintained, and the workers also draw red lines on the screws to keep
an eye on the status of the machines.


This device can
monitor the deformation of the dam.
There are also
equipments at the bottom of the dam to monitor the dam leakage
and lift pressure to ensure the stability
of the dam in several ways.
At the left bank
of Takizawa dam, a concrete revetment was made
to prevent soil erosion. Based on the color
difference of the revetment, we can also determine the long-term water level of
the dam.

The amount of
sediment in the watershed is relatively high because of typhoons and other
reasons. The sediment is used locally to fill the part washed away downstream
or carried to other places for other uses.

There are about 13000t sediment over this place.


This place was originally a reservoir, but because of Typhoon 19,
this reservoir was completely filled with sediment. We can still see some
concrete structures, but the former road and the appearance of the reservoir
are completely invisible.
This visitation
was quite an experience. Dam management is now really digital. In the control
center of Takizawa Dam, we can observe the overall situation of the dam with
the naked eye, and at the same time, we can understand the parameters of the
dam in real time through various digital monitoring devices. The data is stored
in the computer, which is very useful for future management and research.
Learning about
these two dams on the Arakawa River Basin made me more aware of the role of
dams in stabilizing water supplies and preventing natural disasters such as
floods and droughts, and how hard our stable lives are to come by. All these
cannot be achieved without the efforts of the dam design department and the
management department.
こんにちは。M2の五十川です。
先日,中村さんの研究の一環としてタイへ現地調査に行ってきました。
コロナ禍もあったので配属から3年目にして初の海外での調査でした。今回は8/1〜4のアユタヤ視察の,後半の2日間と前後のバンコクでの活動について書いていきます。
8/3 @セーナー地区
セーナー周辺は昨年2021年での洪水でも浸水被害を受けた地域でした。2011年・2021年と2回の大洪水を受けたため,浸水対策を自ら行っている家が多くありました。調査を訪れた当日も,大洪水が来た場合にも家屋の浸水を免れるために高床住居をさらに高くする工事を行っている住居も見受けられました。
 |
| 浸水した跡がくっきり |
午後は役所に訪れて洪水発生当時や発生後の補償等についてお話を伺いました。急に訪問したにも拘らず親切に対応してくださいました。
 |
| セーナー地区の役所にて |
8/4 @バーンバーン地区
バーンバーンもセーナー地区同様昨年の洪水被害を大きく受けた地域でした。
幸い家屋の浸水は免れた住居でも,洪水に伴う土砂の侵食被害が大きくても補償が得られない(家屋が浸水することで補償金が出る)等浸水被害以外で悩む方や,諸条件が重なり浸水被害を受けてもまだ補償が得られず,家を修理するお金が不十分で困っている方等,今でも資金面で課題は残存しているように見えました。
 |
| すぐ横はチャオプラヤ川 |
また,訪れたご家庭の中にはご家族が病院勤務者の方がいて,LINE電話(タイでも日常的に使用されているようです!)を介して昨年の洪水時での救助や病院での状況についてお話を伺うこともできました。
 |
| LINE電話を介した調査の様子 |
8/5 チュラロンコン大学見学&調査結果発表
前日にバンコクに戻り,この日は朝からチュラロンコン大学に訪れました。
まずはキャンパスツアー。建物や道路,広場の規模がどれもこれも大きく,うちの大学よりもすごく広々としていて羨ましいな〜と感じました。ただ驚いたのは大学でも制服があるということ。この日は翌週から授業が始まるタイミングで,制服を着た多数の新入生と見られる人々がキャンパス内を歩いていました。
 |
| 白い所も含め全部がチュラ大の敷地だそうです。広すぎる…! |
ツアー後は都市地域計画を専門とするSutee先生の研究室にお邪魔し,この4日間での活動報告を行いました。アユタヤでの調査ではSutee先生の研究室の学生の方々にも同行していただいたこともあり,調査結果に対する密度の濃い議論を交えてコメントを頂きました。
 |
| 発表の様子 |
冒頭にも書きましたが,M2にして初めての海外での調査でした。過去に研究室のメンバーの,海外を対象とした同様の研究テーマに関する発表を聞いていても,実態が十二分に把握できず歯痒く感じていました。今回の調査を通し,実際現地に訪れることでわかる「生の声」を直接肌で感じ取れた経験は非常に価値のあるものだったと思います。
加えて,個人的には初のタイ,いや生まれてから24年目にして初の海外でした。タイに行く前は不安でいっぱいでしたが,現地の方々が親切に接してくださったお陰で何の大きな事故もなく1週間滞在でき,最終日には日本に帰りたくないと思えるぐらい充実したものになりました。不安感を払拭できたこの成長は,生涯大いに役立つかもしれないと感じました。
最後に,今回の調査に携わってくださった全ての方々に感謝の意を申し上げます。本当にありがとうございました!
川崎グループM2の中村です。7/30から8/6まで、タイに行ってきました!
現在私はタイでの洪水と貧困の研究をしています。タイに限らず、経済の中心地を守るような治水事業が行われがちであり、その影響でかえって貧困層の被害が深刻化することがあります。そこで私の研究は、貧困層・地域内格差も考慮しながら、政策の意思決定を支援することを目標にしています。今回は、主に貧困世帯での洪水の影響を把握するために、調査にいきました。今回のブログでは、8/1,2のアユタヤ視察について書きたいと思います。
8/1 am @ロジャナ工業団地
日本企業も多く進出するロジャナ工業団地を見学しました。2011年に起きた大洪水が工場に甚大な被害をもたらしたため、各工場の周りには高い壁が築かれていました。

 |
| 柱上部の線が2011の浸水高 |
8/1 pm @ロジャナ工業団地近辺の集落
この地域は、ロジャナ工業団地の高い防水壁の影響で浸水深が増大してしまうことがシミュレーションにより分かっています。しかし、工業団地で働く従業員の寮があるなど、工場を守ることでそこで働く人はむしろ大きな被害を受けてしまうのが皮肉だと思いました。また、個人商店を営む世帯に聞き取りを行ったところ、小さな会社で働いていた奥さんが洪水の影響で失業してしまい、それからずっと生活が苦しいという話を聞くことができました。工場や裕福な世帯にとっては被害は一時的でも、貧しい方にとって被害は長く苦しいものだと再認識させられました。

8/2 am @ロジャナ工業団地周辺の集落
前日とは別の地点でも世帯調査を行いました。印象的だったのは2点です。まず、貧しい世帯では借金の返済にかかる利子に長年苦しんでいることです。洪水で被害を受けた家屋を修復するために借金をした、という世帯では10年以上たった今も返済ができておらず、利子が蓄積されてしまっているようでした。そして、2点目として、これらの世帯では家屋の修復で精一杯で、家屋をより頑強のものにする、という次の洪水への備えはできていないということです。様々な世帯で被害額を伺うと、家屋の修復にかかる費用は、事前の補強にかかる費用よりも格段に大きいことがわかりました。しかし、貧困世帯には、補強するお金はなく、結果として大きな被害を受け、借金に陥る、とても皮肉で悲しい事実を目の当たりにしました。
8/2 pm @チャオプラヤ川クルーズ


 |
| ボートの上から遺跡も見れました! |
私は、B4の頃から似たトピックを扱っていましたが、コロナ禍で海外での調査が難しく、もどかしい思いがずっとありました。今回ようやく現地の状況を自分の目で見て、現地の方の生々しい話を聞いて、非常に勉強になりました。
貴重な機会をありがとうございました!
Hello, This is Zhao Han, a Ph.D. student in the Kawasaki Lab, and I am happy to introduce you to some small advances I have made in my research on the sustainable development of the Global Commons.
Human society depends on water for its survival and development, and global water demand has increased nearly eightfold in the past 120 years. The water crisis posed by severe water scarcity has threatened most of the world's countries and water scarcity has been identified as a key issue in the SDG goal 6.
 |
| The Planetary boundaries From: Science |
Freshwater use, as a key component of the planetary boundary, its fine regional studies are considered to be of great importance to the global system. Also an important component of the Global Commons assessment. In particular, China, the world's second-largest economy and one of the top water-scarce countries in the world, has an inconsistent spatial distribution of water. Indeed, it is the increasing inequality of water between regions and sectors that have led to a growing concern for water allocation policies within the country. We need to confront the chronic problem of mismatch between water supply and demand, and a comprehensive understanding of the issues related to water stress is crucial for it.
Based on the above issues, we are interested in answering the following questions: What are the Spatio-temporal patterns of water stresses embodied in China's trade at the provincial scale? How have these WSFs transferred with supply chains?
We used the high-resolution CMRIO-EXIO model developed by ourselves to assess the water stress and blue water footprints of China. The IO model is a quantitative economic model that represents the interdependencies between different sectors of a national economy or different regional economies, additional columns can be added to the model to perform environmentally extended input-output analysis (EE-IOA). For example, information on fossil fuel inputs to each sector can be used to investigate flows of embodied carbon within and between different economies. Through this model, It can easily help us figure out the hotspots of the water stress footprint embodied in trades.

First, the Spatio-temporal patterns and changes in water stress footprint are shown in the above figure.
The Chinese consumption-based WSF accounted for 21% of the global total in 2017 (production-based is 23%). In addition, China's consumption-based BWF increased from 213 km3 in 2012 to 342 km3 in 2017, accounting for 17% of the global total in 2017. In terms of China's provincial accounting, as China's urbanization deepens, spatial disparities in production-based WSF are increasingly serious, with a striking division in WSF between the South and North. WSF embodied in production in Xinjiang (XJ), Hebei (HE), and Shandong (SD), provinces in Northern China, warrant attention. In comparison, consumption-based WSF is much higher than production-based WSF in more affluent provinces (e.g. Zhejiang (ZJ), Beijing (BJ), Tianjin (TJ), and Guangdong (GD)).
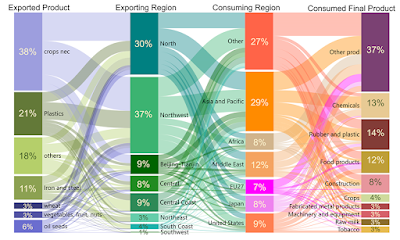
Then, our CMRIO-EXIO model also allows tracking of the international supply chains in the 8 regions of China back to each country and sector where impacts occur.
Water stress from China accounts for 13% of the total imported embodied water stress in the Row Asia and Pacific, followed by South Korea (12%) and Japan (9%). The above figure presents an aggregated supply chain of other regions' water stress outsourced to China. From the production perspective, the economies with the greatest impact on China's WSF are those in Row Asia and the Pacific, along with other major countries such as the US and Japan. The North and Northwest are the regions where other countries/regions transfer the most water stress through consumption (67% of China's total exports). Unlike the type of WSF on the supply chain of Chinese water stress outsourced abroad, which is mainly concentrated in food, WSF on the supply chain of water stress outsourced from abroad to China is spread across many industry types. In addition to agricultural cultivation, industrial products such as plastics and steel exported to meet the international chemical, construction, electromechanical, and other industries further contribute to water stress in Northern China.
More information can be obtained from the following paper: https://doi.org/10.1016/j.scitotenv.2022.156682
If you are interested in this, you are more than welcome to get in touch with us!
初めまして。昨年から川崎グループに入りましたM2の五十川(いそがわ)です。
4/23・24に開催されたアジア・太平洋水サミット(詳細は中村さんの投稿を参照)で熊本に訪れたついでに,25・26日にかけて2年前の豪雨災害を受けた球磨川流域と川辺川ダム建設予定地,建設の際に「蜂の巣城紛争」が起こった下筌ダムを訪れました。
コロナの影響もあり,個人的には研究室配属から3年目にして初の現地視察となりました。
◆25日:球磨川流域,川辺川ダム
池内グループM2の鈴木くんが強力な助っ人としてこの日から同行することに。
まずは球磨川を下流から上流部へと沿うようにして走りました。
 |
| 熊本といえばこの方。びっくり! |
 |
| 線路が隠れて見えない |
 |
| 球磨川を後ろに(@HASSENBA) |
 |
| 欄干が途中からなくなっている |
 |
| 午前中訪れた荒瀬ダム跡 |
 |
| 川辺川ダムの堤体はこの辺りにできるらしい |
◆26日:下筌ダム
この日は朝から天候が悪く,泊まっていたホテルの前に植わっていた木が倒れるほど(!)風雨が強い1日でした。
かつて蜂の巣城紛争と呼ばれる,日本最大級のダム建設反対運動が起こった下筌ダムの見学に訪れました。ダムに行く道すがら資料館に立ち寄りましたが,あいにくの休館日…。この日はダムカレーのお店も定休日で,残念…!またリベンジしたいですね。
まず制御室の中に入り,管理事務所の方によるダム運用の現場について説明を受けました。ここでは令和2年豪雨による下筌ダムの緊急放流等,ダム運用に取り組む方の貴重なお話を伺うことができました。さらに,建設反対派の集落となる蜂の巣城の変遷や紛争の過程について詳細に学びました。
様々な説明を受けたあと,いよいよ実際の堤体内へ。
 |
| 間近より眺める |
 |
| コンジットゲート |
.HEIC) |
| 集合写真 |
熊本滞在もこの日で終わることもあり,ダム見学後はおいしいものを食べました。
 |
| どこからどう見てもおいしいもの |

